At Evolutionary Tree Capital Management, we believe investors are wise to harness innovation to power their portfolios. Why? Simply put, innovation is what sustains growth for companies and drives stock returns over the long term.
In the first of a two-part blog post highlighting the impact of big innovation, we share evidence from various academic and consultant-driven studies that support this theory and profile examples of companies with important innovations sustaining growth.
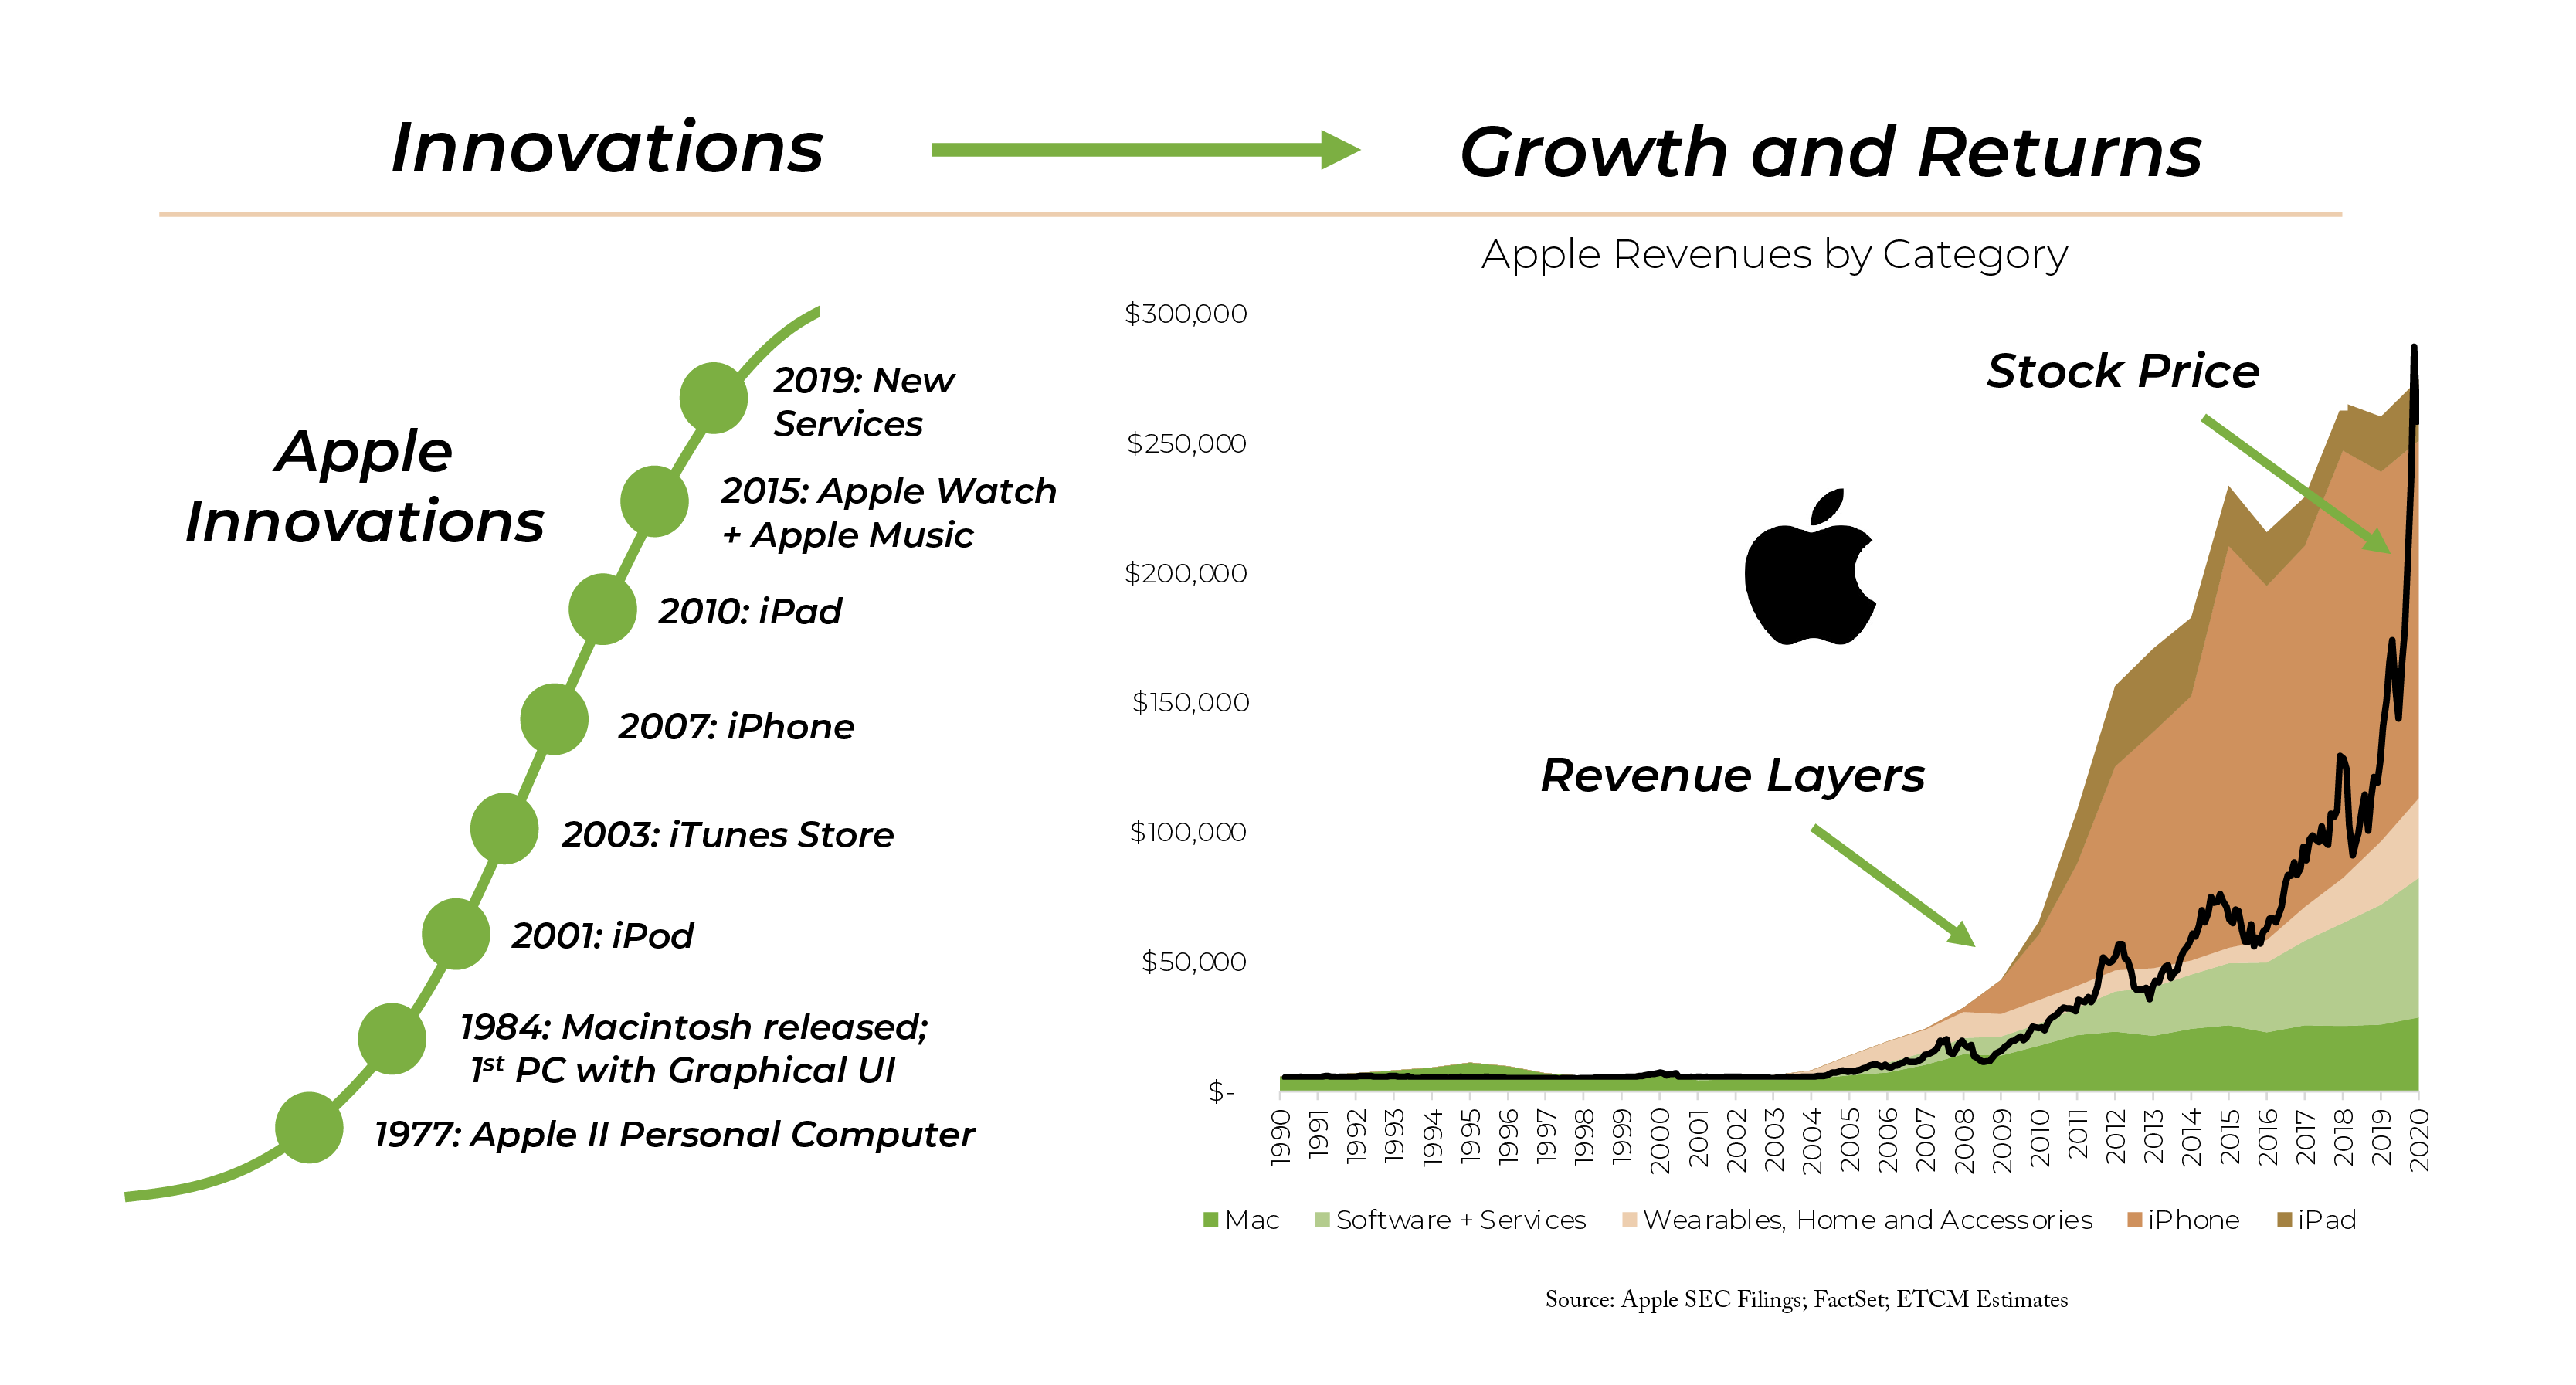
Let’s start with the best exemplar of this dynamic: Apple. While we currently do not own Apple’s stock due to our belief that it is now closer to maturity, Apple is a great historical example of the direct connection between innovation, growth, and investment returns. One can map the contribution, as we have done in the chart below, of each major innovation (on the left) to sustaining revenue growth (on the right). A succession of innovations provided layers of growth that compounded revenues, and profits, at an above-average rate over many years.
 Robust and recent studies support the power of innovation for growth and returns
There have been a variety of academic and consultant-driven studies over the past few decades on the importance of innovation to competitiveness, corporate performance, and investment returns. Most agree that innovation is critical in today’s economy and that real innovation can drive growth, profits, and stock returns. But, the chief challenge has been to define innovation in a manner that delineates which companies are leaders in innovation and which are laggards. Innovation cannot be directly quantified, as it inherently has a qualitative and strategic element to it. Various studies use “proxies” for innovation, such as R&D investment, patent filings, and other measures. While none is perfect, we profile a few studies below which collectively support the importance of innovation to returns.
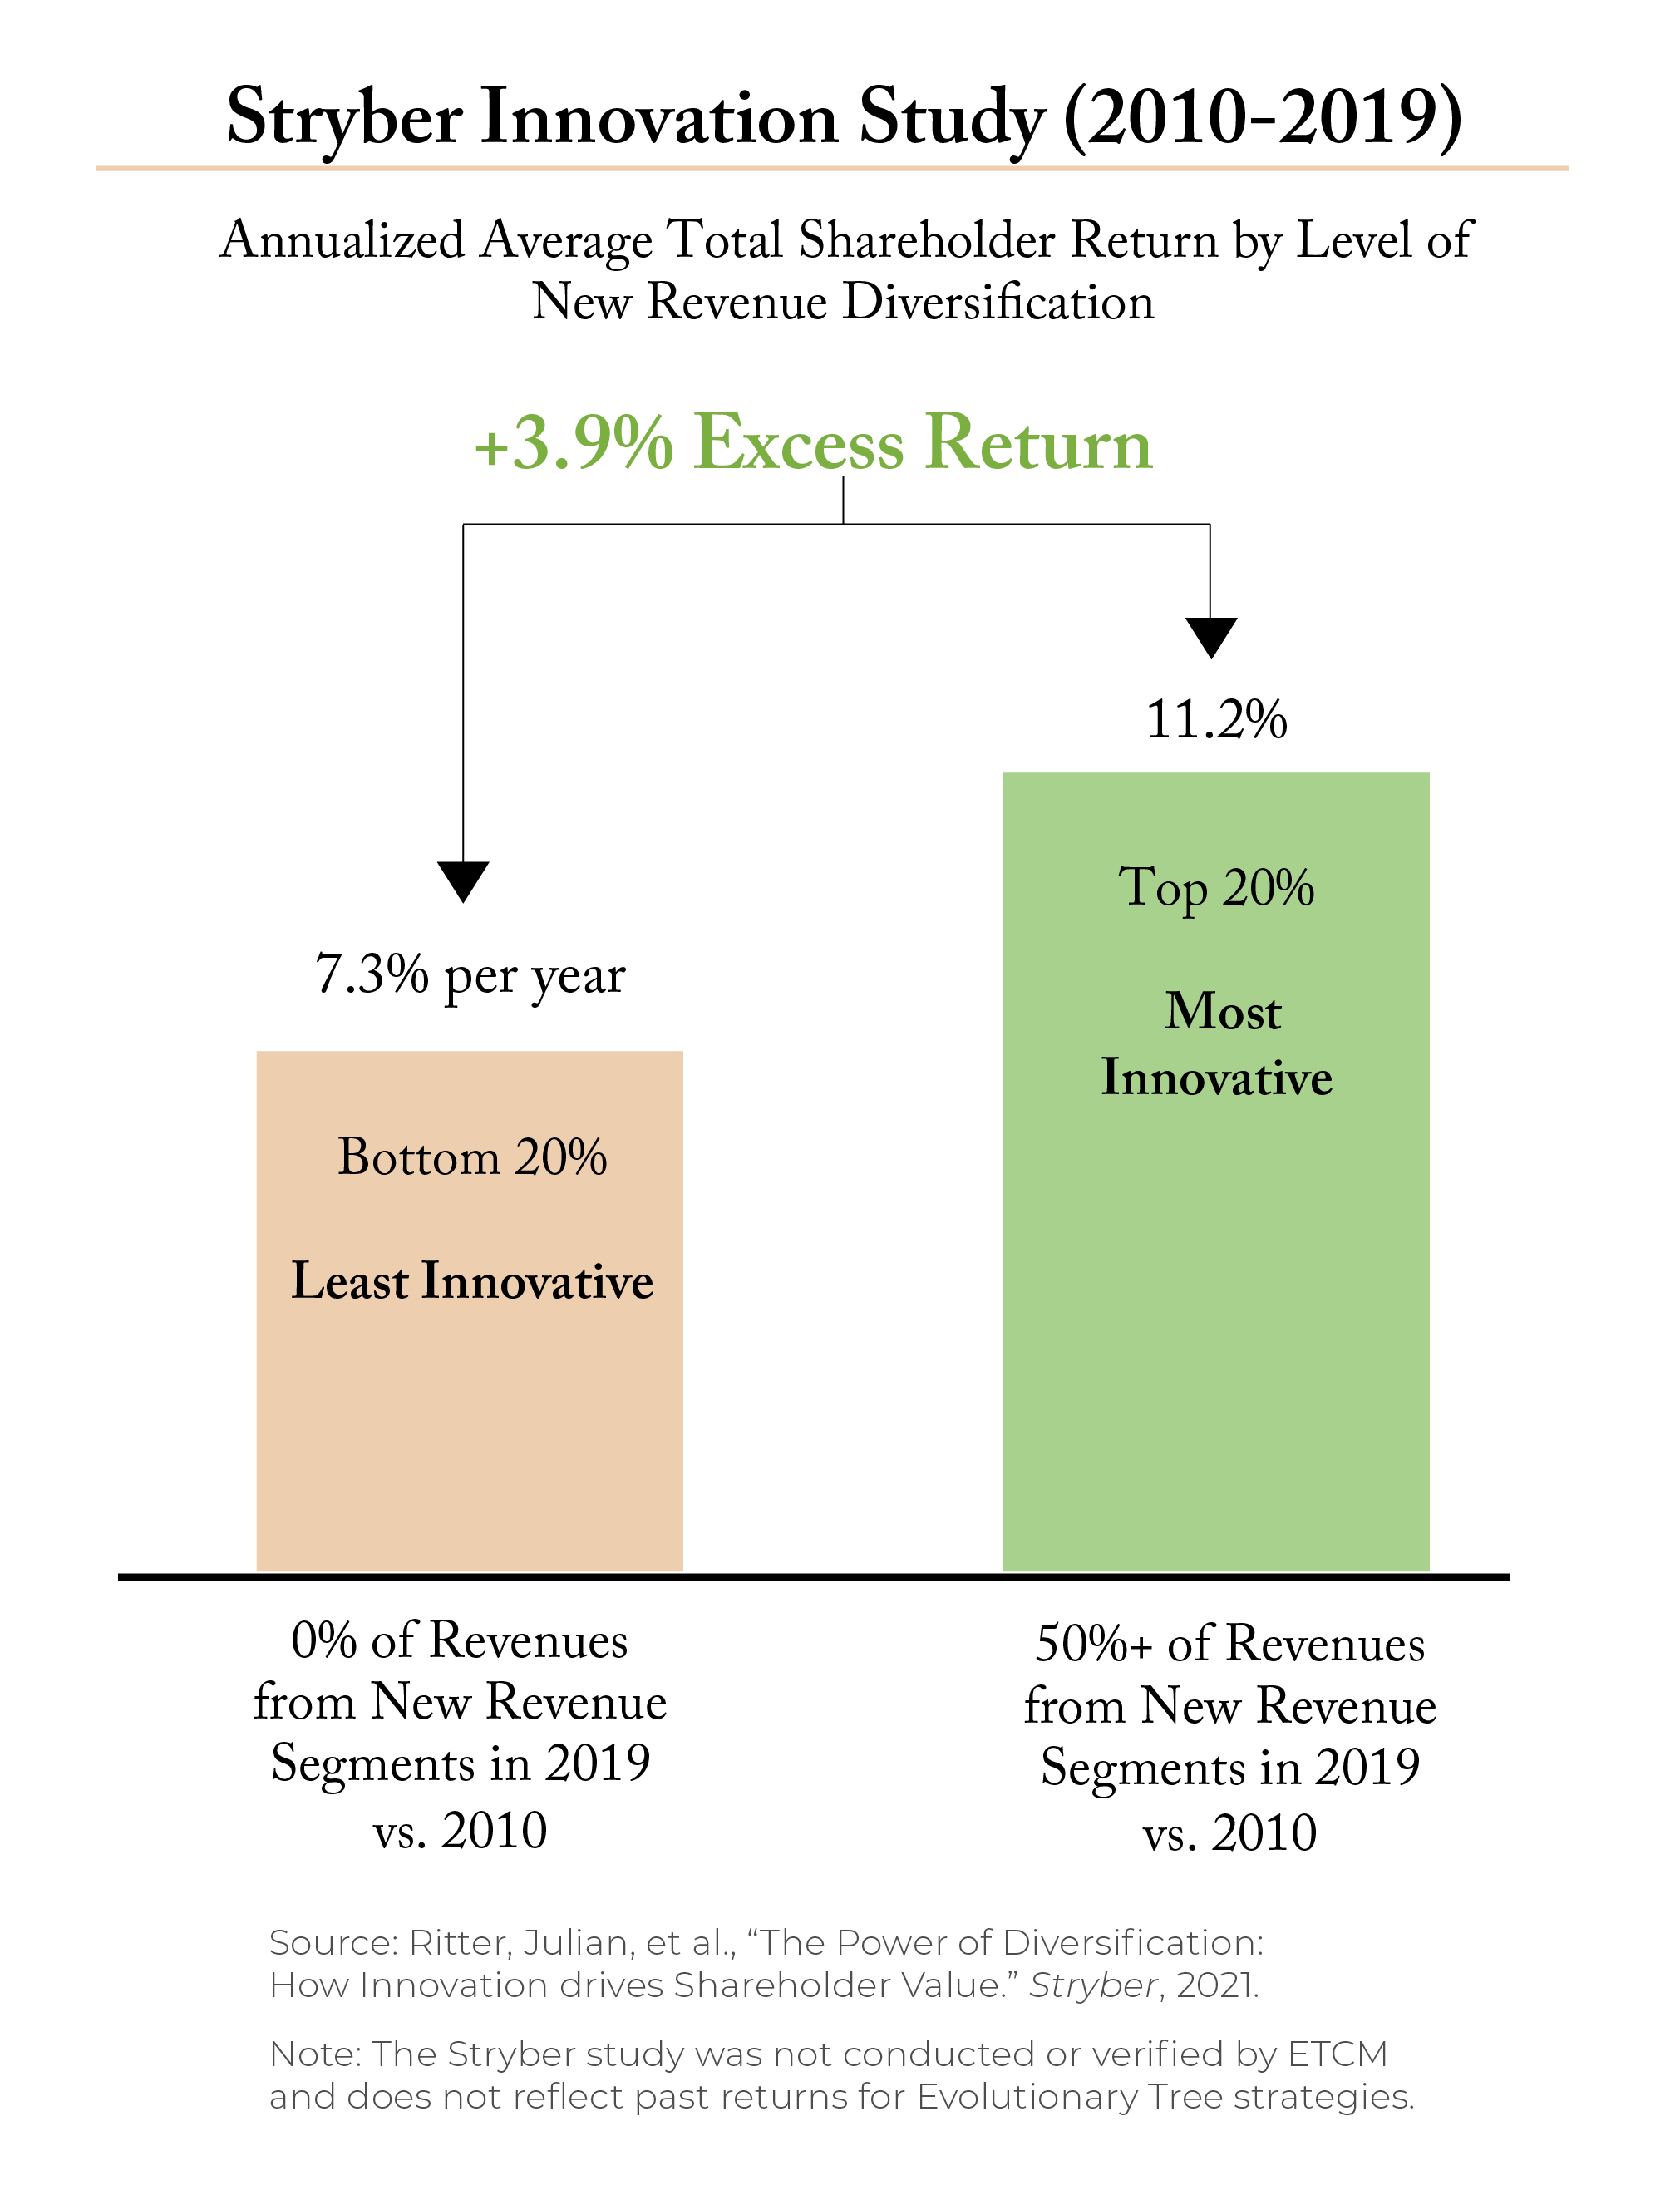
The first study is from an innovation-focused consultant, Stryber, which conducted a rigorous study of 1,838 publicly-traded companies across the US and Europe over a ten-year period (2010-2019). In their study, titled “The power of diversification: How innovation drives shareholder value,” Stryber defined innovativeness as the introduction of new revenue segments. In their words: “We see diversification as a good measure of innovativeness as it reflects a company’s ability to create and commercialize new business models and products addressing new customer needs.” An example they provided was Netflix, which diversified from its original DVD-by-mail service to the subscription-based streaming service we know (and love) today. This framework has merit to it, and our Apple example above provides a similar example of the power of diversification through innovation.
What were the results of this innovation study? Companies with no new revenue segments or business models vastly underperformed companies where more than 50% of revenues came from new segments. The most innovative companies delivered returns that were 3.9 percentage points per year above the innovation laggards.
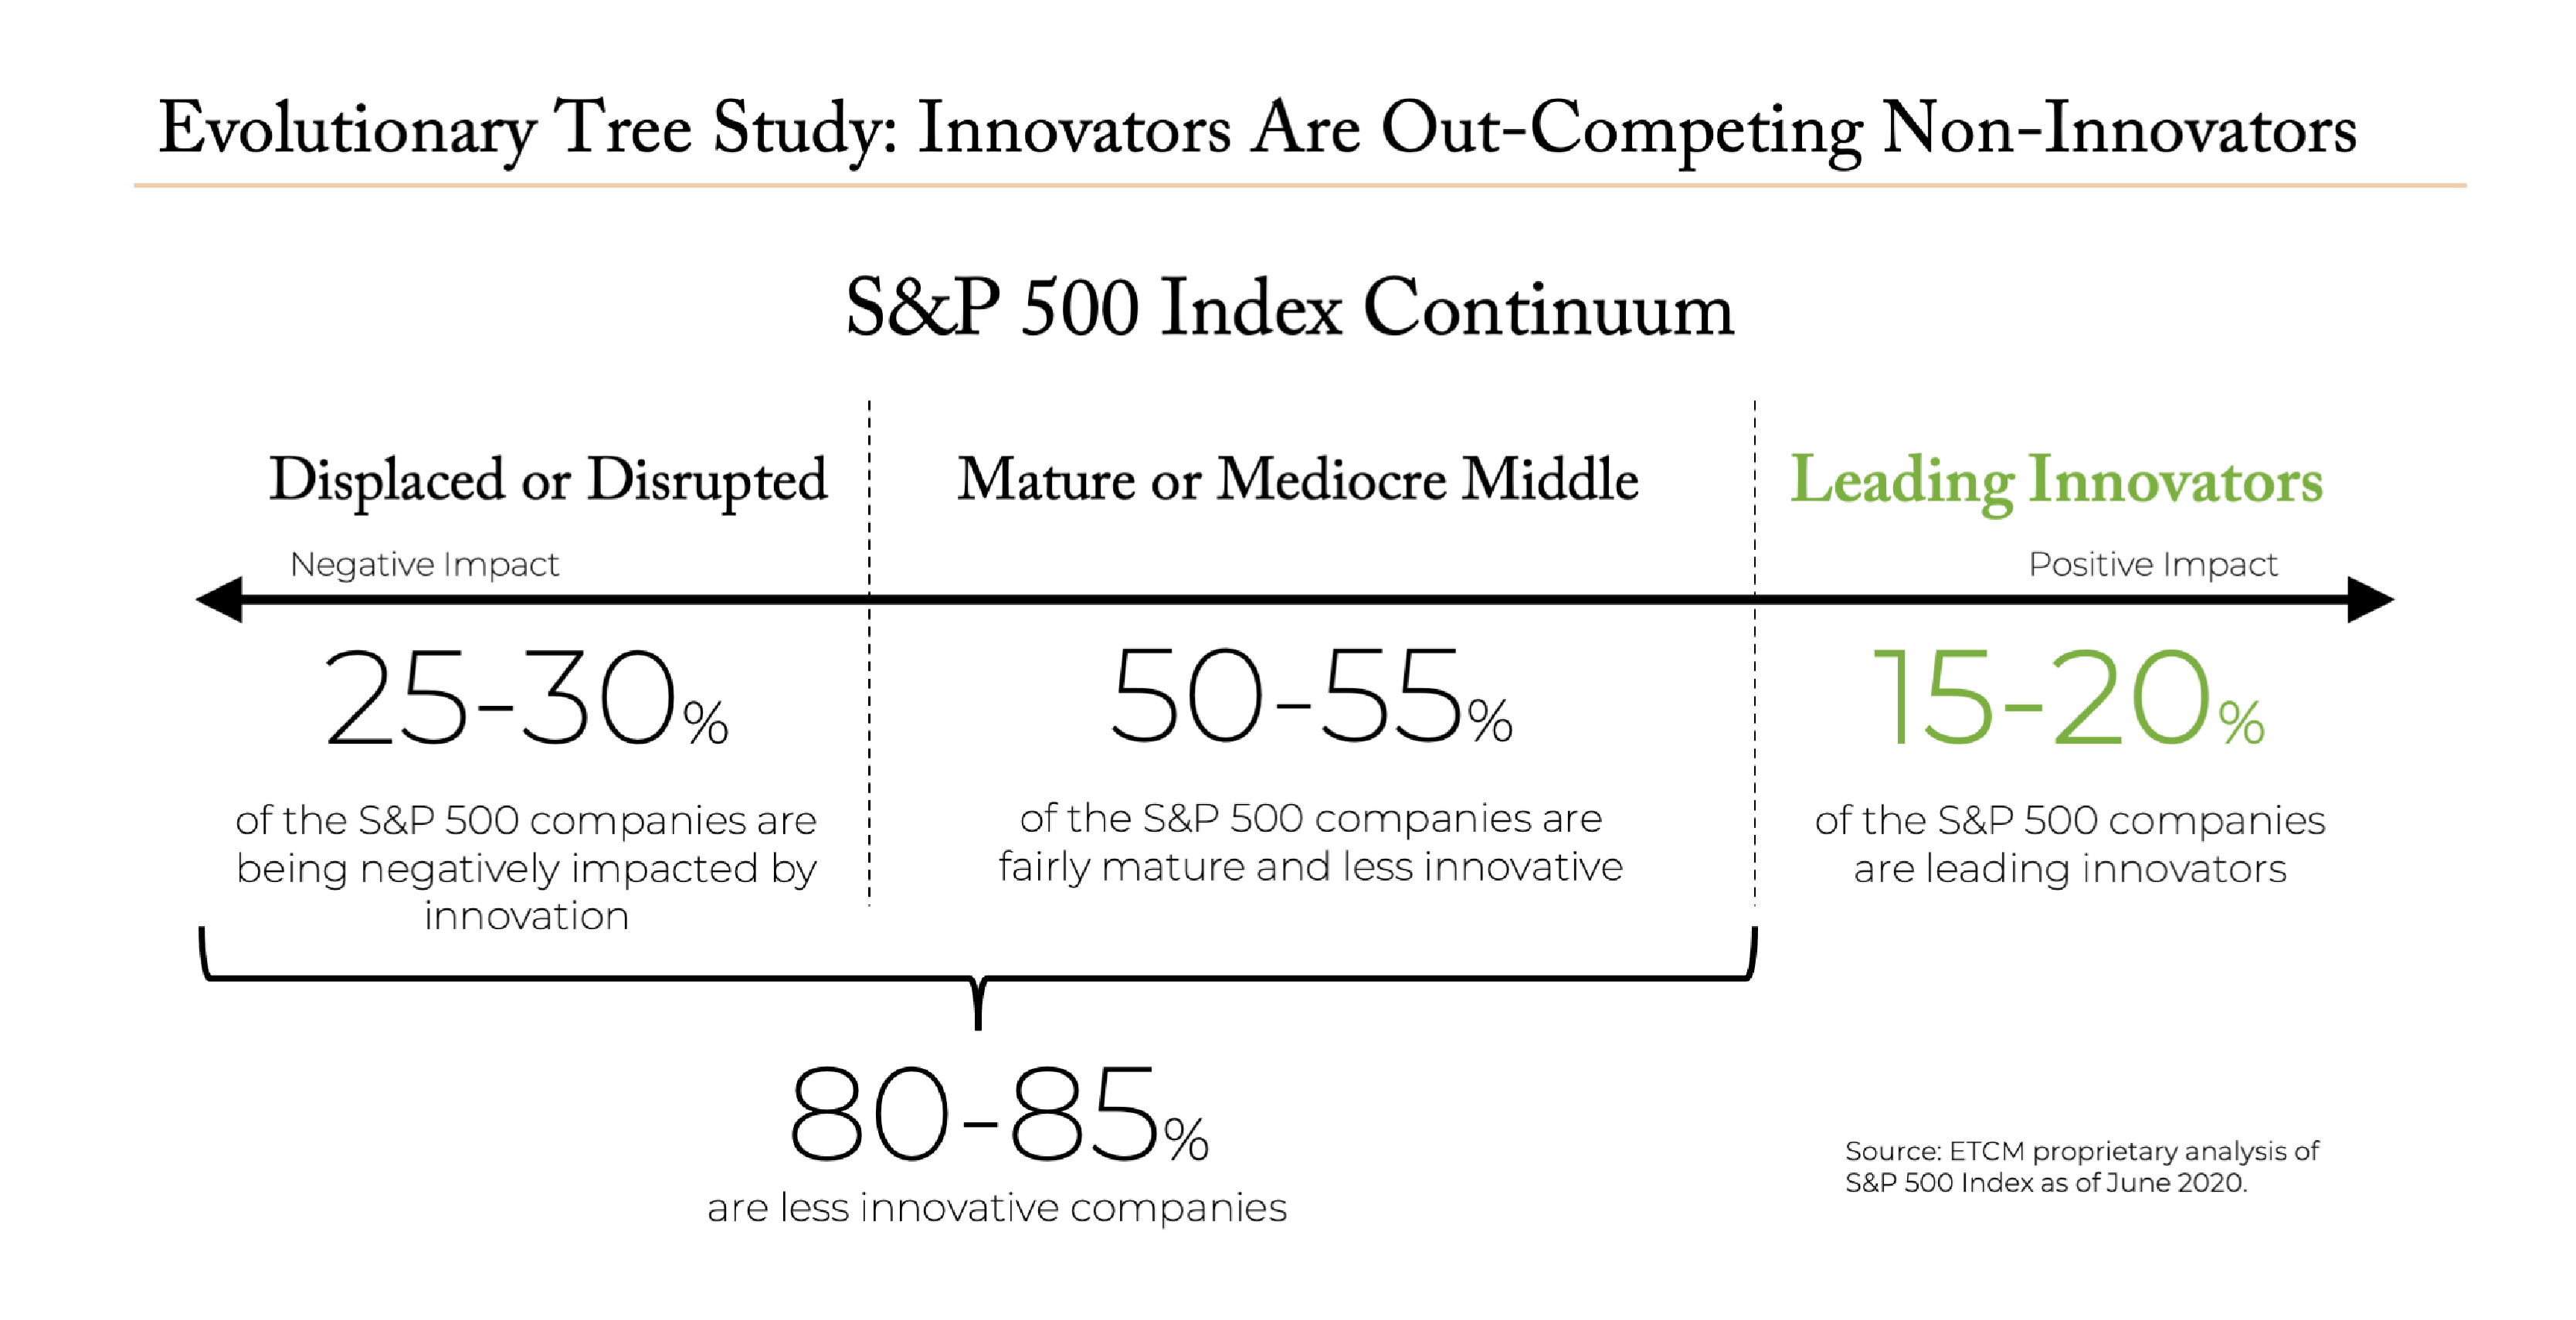
This study also provided support for the idea of dividing companies into innovation leaders and laggards, a study we performed ourselves on the S&P 500 Index in 2020. Stryber’s data support our conclusion that 15%-20% of the S&P 500 are leading innovators while 80%-85% are less innovative. Specifically, the data showed that about 83% of the companies in the Stryber study were innovation laggards (defined as companies with 10% or less diversification in sales over the period), while 17% of companies were innovative. This supports the idea that innovators are rare.
The takeaway for investors is that these types of innovative businesses are best owned in concentrated portfolios, selected by specialists in innovation investing with the capabilities to research and identify the true innovators.
A second study comes out of the University of Technology Sydney (authored by Bedford, Ma, and Vojvoda), based on a large-scale study of 1,296 Australian companies that trade on the ASX between 1997 and 2018. Specifically, the study examined patent registrations by these firms and found that innovative firms—those with more patent filings—were associated with sustained profitability and higher future stock returns. The data mirrors similar findings by a separate US-focused study published in 2018 (Hirshleifer, et al). This makes intuitive sense—companies which innovate new features with a level of novelty that merits the cost of patenting create the conditions to drive higher profitability and, in turn, investment returns. Innovation investment offers rewards.
In an aptly-titled article in the Harvard Business Review, “Wall Street Doesn’t Understand Innovation,” the author, Christopher Malloy, finds that: “Even though a company’s success at innovation can be predicted by looking at its track record, investors don’t favor the stocks of firms that have proved they’re effective at R&D.” In other words, innovators often go underappreciated by Wall Street until growth has proven out over a number of years, a lag that creates opportunity. At Evolutionary Tree, we take advantage of that lag with our innovation-focused strategies and approach.
We’ll share more in a follow-up blog post titled “Big Innovation Has Impact.”